
Functional Skills: Scatter Graphs
Scatter Graphs
We use scatter graphs to determine the existence and type of correlation between two variables.
If the graph shows a relationship between the variables, we say they have correlation.
There are 4 skills that you need to learn for scatter graphs.

Skill 1: Correlation
If there is a relationship between two variables, we say there is a correlation.
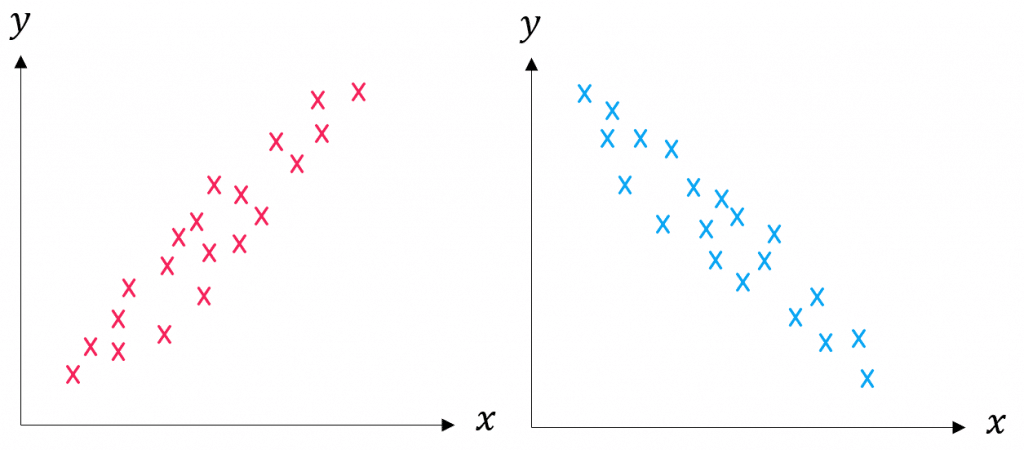
There are two types of correlation:
Positive correlation – as one variable goes up, the other also goes up.
Negative correlation – as one variables goes up, the other goes down.
If the points are randomly spread, we say there is no correlation.
Follow Our Socials


Follow our Facebook for community support


Follow our Instagram & TikTok for revision help
Our Facebook page can put you in touch with other students of your course for revision and community support. Alternatively, you can find us on Instagram or TikTok where we're always sharing revision tips for all our courses.
Follow our socials for revision tips and community support
Skill 2: Drawing Scatter Graphs
Example: The table below shows the results of students’ Maths and English exams out of . Plot a scatter graph for this information.

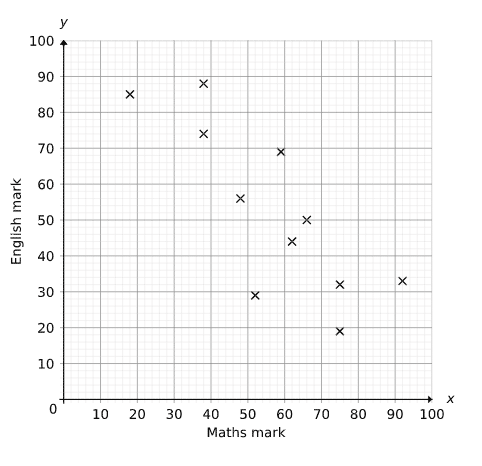
Draw the axes. One should be for the ‘Maths mark’, making sure it goes up to at least and the other should be for the ‘English Mark’, making sure it goes up to at least also. Label the axes.
Then, plot the data as shown on the graph to the right (similar to plotting coordinates) e.g. for someone who got on their maths exam and on their English exam, go across to on the -axis and then up to on the -axis, and draw a cross or a dot.
Note: This graph has a negative correlation, because as the Maths mark increases, the English mark decreases.
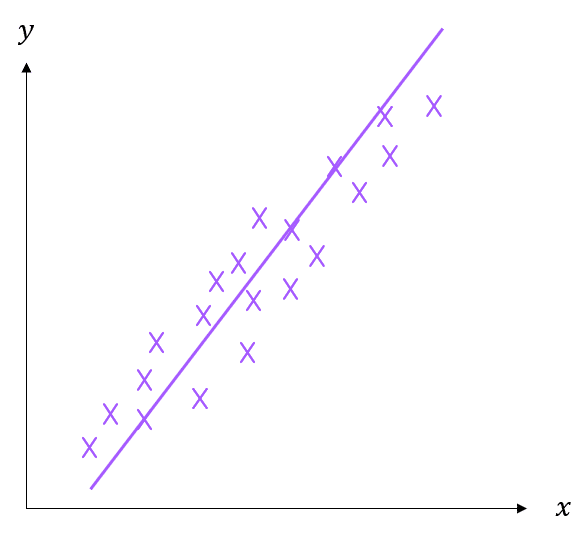
Skill 3: Drawing a Line of Best Fit
A line of best fit is a straight line that is used to represent the correlation of the data.
Lines of best fit should go through the middle of all the points, with an equal number of points on either side of the line.
Note: Make sure you use a sharp pencil and a ruler when drawing a line of best fit.

Skill 4: Using a Line of Best Fit
If you know one value on a scatter graph, you can use a line of best fit to predict the other value.
Example: Predict the English mark of someone that scored a mark of in Maths, using the following scatter graph.
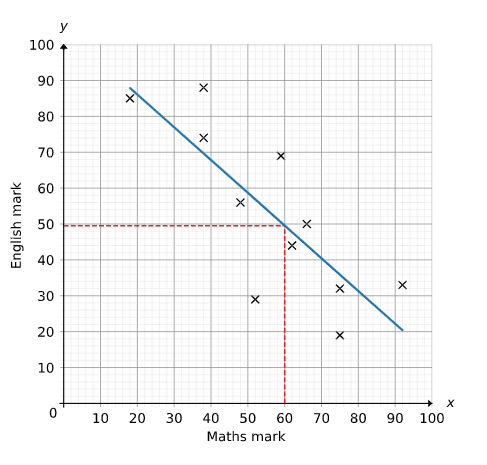
Firstly, we need to draw a line of best fit through the points, as seen previously.
Then, to find the English mark of someone who scored in Maths, go up from on the -axis until you meet the line of best fit.
Finally, go across to the -axis and read off the value. Therefore the predicted English mark is .
Functional Skills: Scatter Graphs Example Questions
Question 1: For each scatter graph below, state whether or not there is correlation and, if so, state type of correlation.
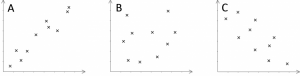
[3 marks]
A: As the values on the -axis increase, so do the values on the -axis. Therefore there is a positive correlation.
B: All of the points are randomly scattered. Therefore there is no correlation.
C: As the values on the -axis increases, the value on the -axis decreases. Therefore there is a negative correlation.
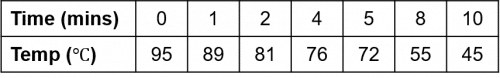
Question 2: John records the temperature of a cup of coffee over time. The results are shown in the table below:
a) Draw a scatter graph for the data.
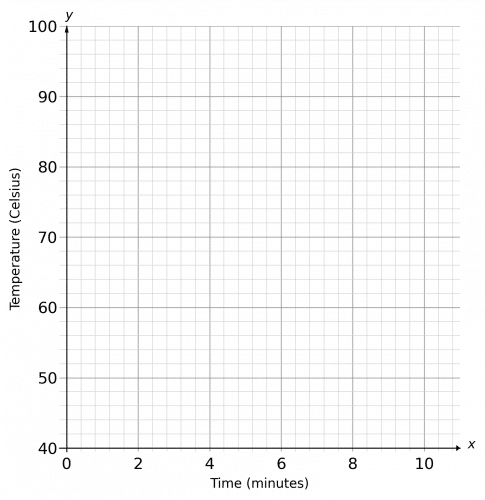
[3 marks]
b) State the type of correlation.
[1 mark]
c) Estimate the temperature of a cup of coffee after minutes.
[1 mark]
a) Draw the axes; one should be for the ‘Time’ (making sure it goes up to at least ) and the other for the ‘Temperature’ (making sure it goes up to at least ). Label the axes.
(Since the lowest temperature is , you could start at on the -axis instead of 0)
Plot the points and mark them with crosses.
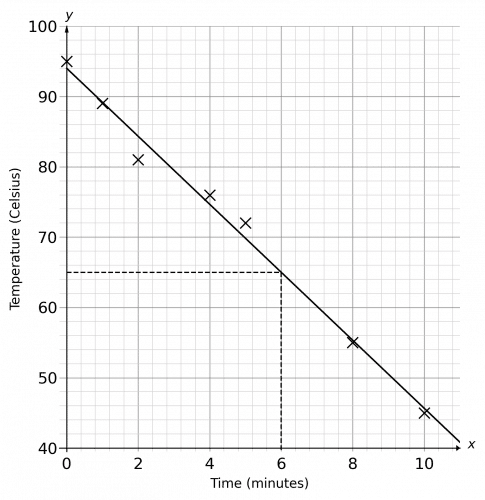
b) We can see that as the time increases, the temperature decreases. Therefore the correlation is negative.
We can draw a line of best fit to make sure – we need this for part (c) anyway.
c) To predict the temperature of a cup of coffee after minutes, go up from on the -axis until you meet the line of best fit. Then, go across to the -axis and read off the value.
The predicted temperature of a cup of coffee after minutes is
(allow between and , because your line of best fit may be slightly different)
Question 3: The table below shows the number of hours of revision a group of students spent revising for an exam and the score they achieved:
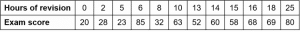
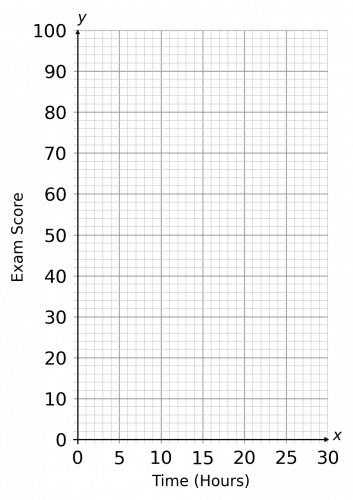
a) Plot these points on the axes below.
[2 marks]
b) Predict the exam score of a student who completes hours of revision.
[1 mark]
a) Plot the data points, and mark them with crosses.
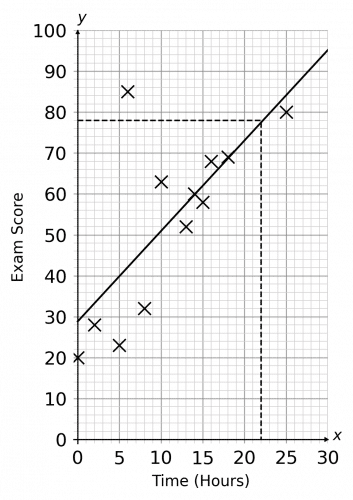
b) To predict the exam score of a student who completes hours of revision, we need to draw a line of best fit, with an equal number of points on either side of the line.
Then, go up from on the -axis until you meet the line of best fit. Then, go across to the -axis and read off the value. So, the predicted score of someone who completes hours of revision is
(allow to , since your line of fit might be slightly different.)
Specification Points Covered
L2.28 – Draw and interpret scatter diagrams and recognise positive and negative correlation
Functional Skills: Scatter Graphs Worksheet and Example Questions
Scatter Graphs L2
FS Level 2NewOfficial PFSRevision Products
Functional Skills Maths Level 2 Book
Revise and practice for your functional skills maths level 2 exam. All topics covered in this compact functional skills maths revision guide book.
Functional Skills Maths Level 2 Mini Tests
Practice for your functional skills Maths level 2, questions from every topic included.
Functional Skills Maths Level 2 Revision Cards
Revise for functional skills maths level 2 easily and whenever and wherever you need. Covering all the topics, with revision, questions and answers for every topic.
Functional Skills Maths Level 2 Practice Papers
This 5 set of Functional Skills Maths Level 2 practice papers are a great way to revise for your Functional Skills Maths Level 2 exam. These practice papers have been specially tailored to match the format, structure, and question types used by each of the main exam boards for functional skills Maths. Each of the 5 papers also comes with a comprehensive mark scheme, so you can see how well you did, and identify areas to improve on.
Functional Skills Maths Level 2 Practice Papers & Revision Cards
This great value bundle enables you to get 5 functional skills maths level 2 practice papers along with the increasingly popular flashcard set that covers the level 2 content in quick fire format.