Functional Skills: Probability Tables
Probability Tables
You may need to use tables or diagrams to help you find probabilities.
There are 2 types of probability table that you will need to understand.
Make sure you are happy with the following topics before continuing.
Type 1: Two-Way Tables
One type of table you will encounter is a two-way table.
Example: The table shows some information about the ages of boys and girls in a school.
A boy is chosen at random. What is the probability that the boy is aged under 13?
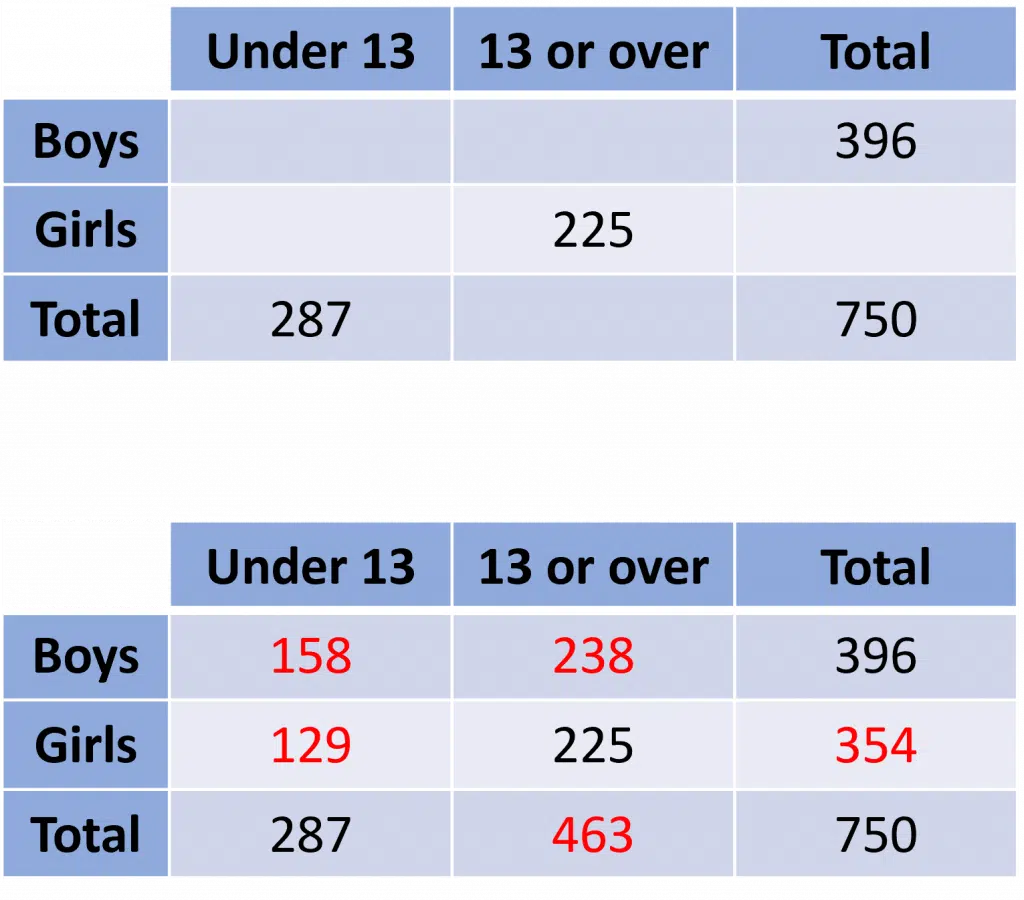

Step 1: Use addition and subtraction to find the missing values in the table, e.g.
Total number of girls = 750 - 396 = \textcolor{red}{354}
Total number of students aged 13 or over = 750 - 287 = \textcolor{red}{463}
Total number of girls aged under 13 = 354 - 225 = \textcolor{red}{129}
Total number of boys aged 13 or over = 463 - 225 = \textcolor{red}{238}
Total number of boys aged under 13 = 287 - 129 = \textcolor{red}{158}
Note: This could have been done in a different order with different sums.
Step 2: Find the probability. The total number of boys is 396, of which 158 are aged under 13
So, the probability is
\dfrac{158}{396}
Type 2: Tables for Multiple Events
When there are two events, it is useful to write down all possible results in a table for multiple events. You can then find probabilities using the table.
Example: Two spinners, both numbered 1 to 5, are spun and the outcomes are added together.
What is the probability that the result is 7?
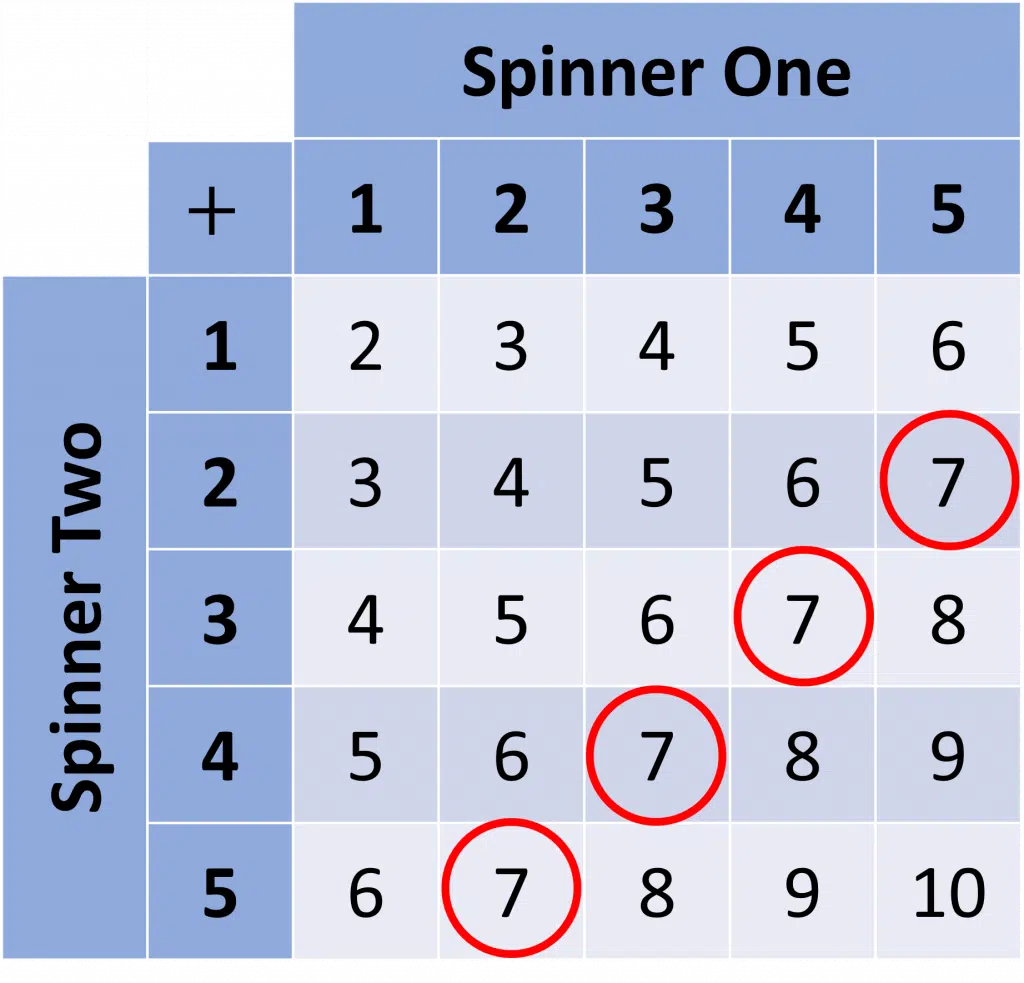

Step 1: Draw a table to write down all possible results, as shown.
Step 2: Fill in the table with the results, e.g. if you land on 2 on spinner one and 4 on spinner two, then the result is
2 + 4 = 6
Step 3: Calculate the probability. There are \textcolor{limegreen}{25} possible outcomes, and \textcolor{red}{4} of these are 7 (circled in red).
So, the probability is
\dfrac{\textcolor{red}{4}}{\textcolor{limegreen}{25}} = 0.16
Follow Our Socials
Our Facebook page can put you in touch with other students of your course for revision and community support. Alternatively, you can find us on Instagram or TikTok where we're always sharing revision tips for all our courses.
Functional Skills: Probability Tables Example Questions
Question 1: Pupils in a school can either choose to have a hot dinner or packed lunch. The table below shows some information about the choices of the Year 4 pupils.
a) One of the pupils is chosen at random. What is the probability that they have a packed lunch and are a boy? Give your answer as a decimal.
b) One of the pupils that chose a hot dinner is chosen at random. What is the probability that they are a girl?
[3 marks]
a) In total, there are
12 + 14 + 15 + 9 = 50 pupils
14 boys chose to have a packed lunch.
So, the probability is
\dfrac{14}{50} = 0.28
b) The number of pupils that chose a hot dinner is
12 + 15 = 27
15 of these are girls.
So, the probability is
\dfrac{15}{27}
Question 2: The table below shows some information about the number of employed and unemployed people in a village.
a) Complete the two way table.
b) Find the probability that a person chosen at random is unemployed. Give your answer to three decimal places.
[5 marks]
a) Complete the table using addition and subtraction, e.g.
196 - 156 = 40 unemployed males
254 - 156 = 98 employed females
40 + 32 = 72 unemployed people in total
98 + 32 = 130 females in total
254 + 72 = 326 people in total
The completed table will look like this:
b) There are 326 people in total. 72 of these people are unemployed.
So, the probability is
\dfrac{72}{326} = 0.221 (3 dp)
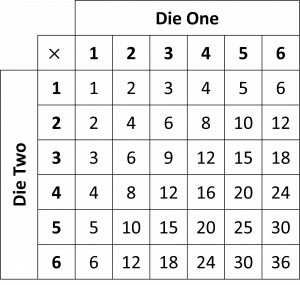
Question 3: Two dice, both numbered 1 to 6, are rolled together. Their scores are multiplied together.
a) Complete the table below to show the possible results.
b) What is the probability that the result is 12?
c) What is the probability that the result is over 20?
[4 marks]
a) Multiply each number in each row with each number in each column.
The table completed table will look like this:
b) There are 36 results in total.
The result is 12 a total of 4 times.
Therefore, the probability is
\dfrac{4}{36} = \dfrac{1}{9}
c) The results that are over 20 are 24, \, 25, \, 30 and 36
The result is over 20 a total of 6 times out of 36
Therefore, the probability is
\dfrac{6}{36} = \dfrac{1}{6}
Specification Points Covered
L2.26 – Work out the probability of combined events including the use of diagrams and tables, including two-way tables
L2.27 – Express probabilities as fractions, decimals and percentages
Functional Skills: Probability Tables Worksheet and Example Questions
Probability Tables L2
FS Level 2NewOfficial PFSRevision Products
Functional Skills Maths Level 2 Book
Revise and practice for your functional skills maths level 2 exam. All topics covered in this compact functional skills maths revision guide book.
Functional Skills Maths Level 2 Mini Tests
Practice for your functional skills Maths level 2, questions from every topic included.
Functional Skills Maths Level 2 Revision Cards
Revise for functional skills maths level 2 easily and whenever and wherever you need. Covering all the topics, with revision, questions and answers for every topic.
Functional Skills Maths Level 2 Practice Papers
This 5 set of Functional Skills Maths Level 2 practice papers are a great way to revise for your Functional Skills Maths Level 2 exam. These practice papers have been specially tailored to match the format, structure, and question types used by each of the main exam boards for functional skills Maths. Each of the 5 papers also comes with a comprehensive mark scheme, so you can see how well you did, and identify areas to improve on.
Functional Skills Maths Level 2 Practice Papers & Revision Cards
This great value bundle enables you to get 5 functional skills maths level 2 practice papers along with the increasingly popular flashcard set that covers the level 2 content in quick fire format.


