
Functional Skills: Bar Charts
Bar Charts
Bar charts (or bar graphs) show data in a visually appealing way.

Understanding Bar Charts
A bar chart is plotted on two axes (a singular one is called an axis).
They are split into categories, using bars of different heights.
Here is an example:
Susie counts the number of cars that pass her window in 5 minutes, and records the colour of each car. She plots the bar chart below.
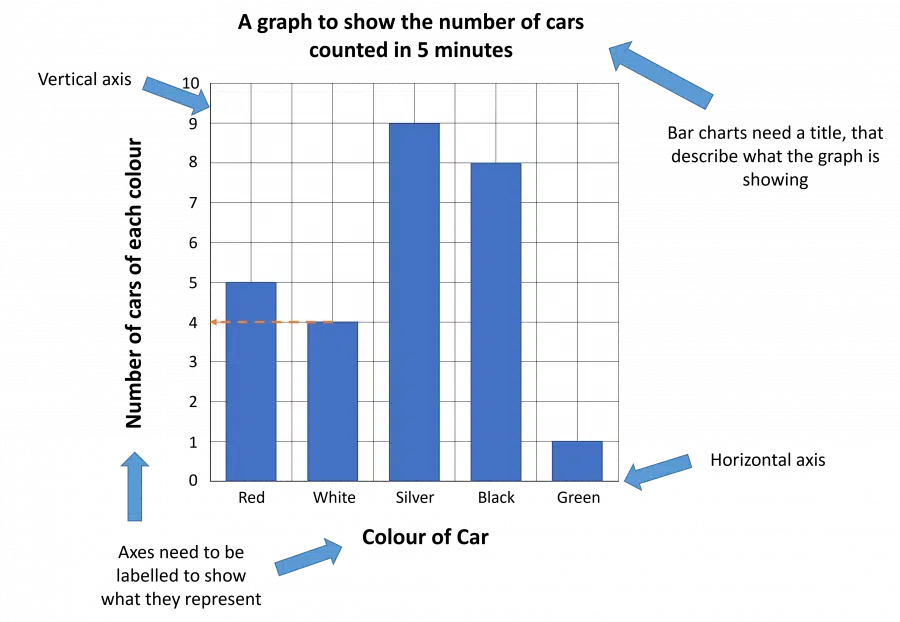
The height of each bar shows how many of each colour of car there were. All you need to do is read across from the top of the bar until you meet the vertical axis, e.g. there were \boldsymbol{4} white cars that passed Susie’s window in 5 minutes.
You can make conclusions by looking at the bar chart, e.g. there were more silver cars than any other colour that passed Susie’s window in 5 minutes.

Follow Our Socials


Follow our Facebook for community support


Follow our Instagram & TikTok for revision help
Our Facebook page can put you in touch with other students of your course for revision and community support. Alternatively, you can find us on Instagram or TikTok where we're always sharing revision tips for all our courses.
Follow our socials for revision tips and community support
Drawing Bar Charts
You will need to be able to draw a bar chart, given some data.
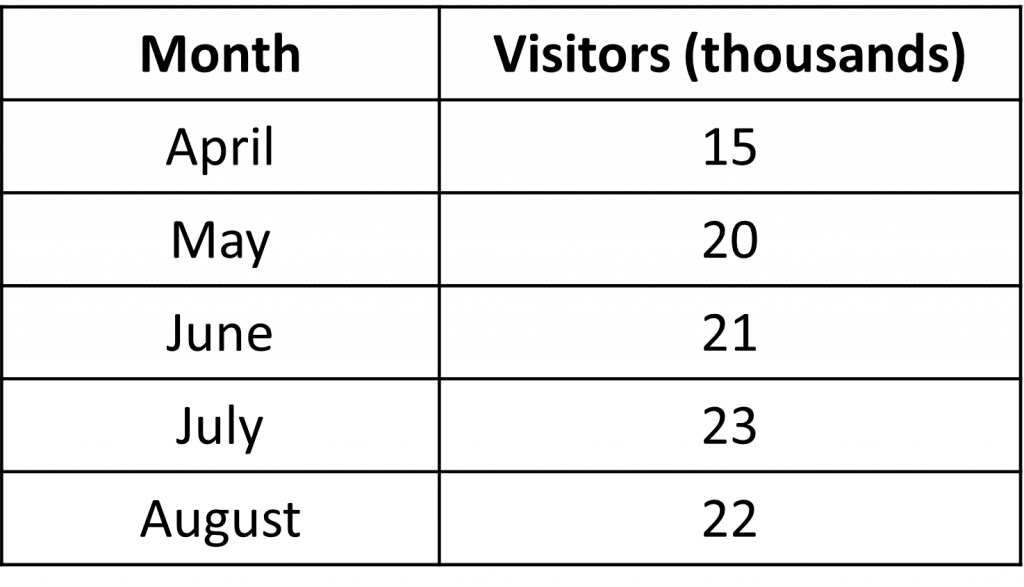
Example: The table shows the number of visitors at a tourist attraction over a 5-month period.
The bar chart will need to show the months and the number of visitors (in thousands) to the tourist attraction. The axes will represent these.
We have to make sure the axes will be high enough and wide enough. We therefore need to work out the scale for the axes, which is what each small square will represent.
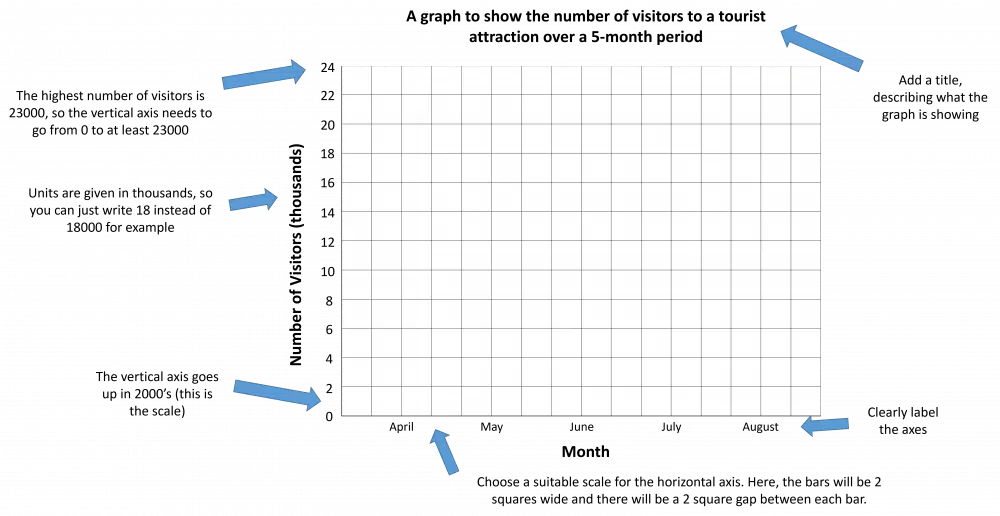
Finally draw the bars on the chart. Make sure you use a ruler to draw the bars, so that they are neat and accurate.
The bars need to be the same width and need the same size gap between them.
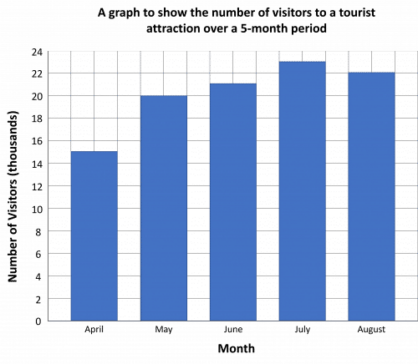
The final drawing will look like this:
Completing Bar Charts
For Entry level 3, you will be given an incomplete bar chart and/or table and have to finish them off.
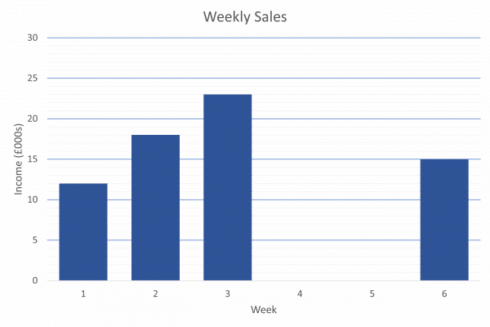
Example: Here is an incomplete bar chart of a company’s weekly income for 6 weeks, as well as a incomplete report in a table format.
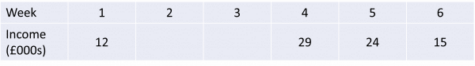
Complete the table and the bar chart.
Analysing the Bar Chart:
We can see that in Week 2, the company has an income of \textcolor{orange}{£18000}.
We can also see that the company has a weekly income of \textcolor{red}{£23000} in Week 3.
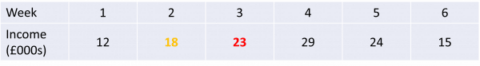
So, we can fill in the table.
Analysing the Table:
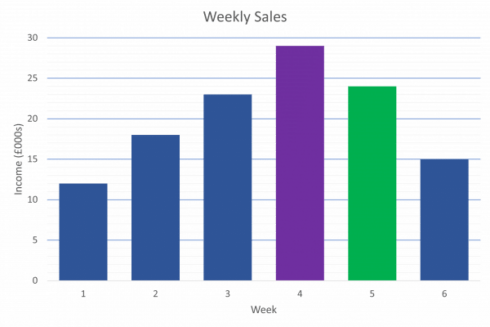
The table gives the missing values at Week 4 and 5 as \textcolor{purple}{£29000} and \textcolor{limegreen}{£24000} respectively.
So, we can complete the bar chart.
Functional Skills: Bar Charts Example Questions
Question 1: Megan goes on a safari trip and counts the number of animals she spots and the type of animal.
She then plots her results on the bar chart below.
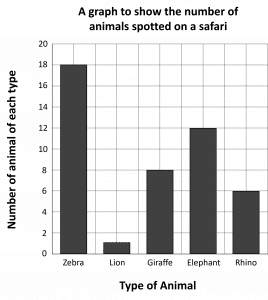
a) How many giraffes did Megan see?
b) Which type of animal did she see the most of?
c) How many animals did she see altogether?
[4 marks]
a) The height of the ‘giraffe’ bar is 8, so Megan saw 8 giraffes.
b) The ‘zebra’ bar is the tallest, so the type of animal that Megan saw the most of was the zebra.
c) Total = 18+1+8+12+6=45
Question 2: Romeo asks each of his classmates to choose their favourite fruit from 8 options. He records the results in the bar chart below.
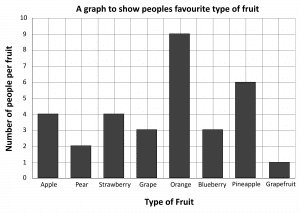
a) Which option was chosen the least?
b) How many more people chose apple compared to pear?
c) How many people were asked in total?
[5 marks]
a) The bar for grapefruit is the smallest, so this option was chosen the least.
b) Number of people who picked apple =4
Number of people who picked pear = 2
Difference =4-2=2
c) Total = 4+2+4+3+9+3+6+1=32
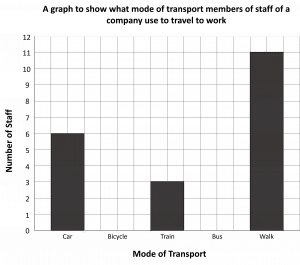
Question 3: A manager at a company asked their members of staff what mode of transport they use to travel to work.
They record their results in the table below.
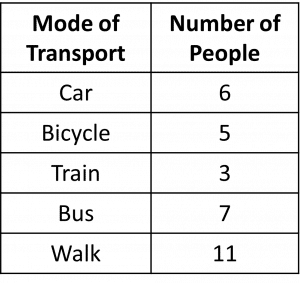
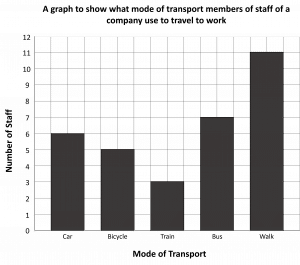
Draw a bar chart for this data, making sure you clearly label your axes.
[4 marks]
There is no particular way you have to do this, but here we will go up in 1‘s on the vertical axis and we will make each bar 2 squares wide with 1 square left between each bar.
We will also label the axes and give the chart a title, to describe what the chart is showing.
Your completed bar chart may look something like this:
Question 4: A manager at a company asked their members of staff what mode of transport they use to travel to work.
They record their results in the table below.

They also draw part of the following bar chart.
Complete the bar chart.
[2 marks]
We need to draw a bar up to 5 for bicycle, and draw a bar up to 7 for bus:
Specification Points Covered
EL3.21 – Extract information from lists, tables, diagrams and charts and create frequency tables
EL3.22 – Interpret information, to make comparisons and record changes, from different formats including bar charts and simple line graphs
EL3.23 – Organise and represent information in appropriate ways including tables, diagrams, simple line graphs and bar charts
L1.27 – Represent discrete data in tables, diagrams and charts including pie charts, bar charts and line graphs