
Functional Skills: Tally Charts
Tally Charts
Tally Charts are used to record results “on-the-fly”. They’re most commonly used in surveys, questionnaires and general data collection, and are particularly useful for situations where results are being recorded manually.

How to Use a Tally Chart
First, we need to set up a table of options. So, for example, let’s say we have a group of people voting for where they should order a takeaway from.
Their options are Italian, American, Chinese and Indian.
Each person’s choice is marked on the table by a strike “|”, and for every fifth choice in a category, the strike is laid diagonally over the previous four. This is done to help you count the marks afterwards, as having multiple strikes in a row can be hard to count.
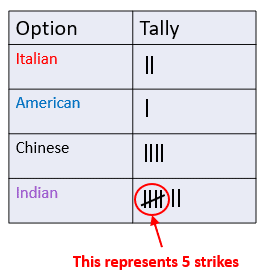
So, we can see that the most popular option is clearly Indian, as it has the most strikes.
Follow Our Socials


Follow our Facebook for community support


Follow our Instagram & TikTok for revision help
Our Facebook page can put you in touch with other students of your course for revision and community support. Alternatively, you can find us on Instagram or TikTok where we're always sharing revision tips for all our courses.
Follow our socials for revision tips and community support
Converting a Tally Chart to a Frequency Table
We can now input a frequency column to turn this Tally Chart into a Frequency Table. Here, we count the number of strikes in the chart for each option, and convert this into a numerical value. This allows us to work with data much more quickly. Take the last example:
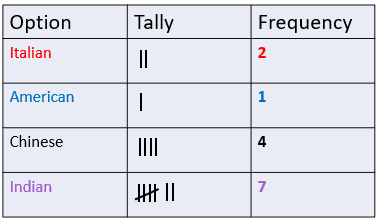
We can verify that Indian is the most popular option here, with votes.
If we wanted further look into our responses, i.e. by finding the difference between votes, the total number of votes, etc., we could save a lot of time by including the frequency table to reference back from.
Functional Skills: Tally Charts Example Questions
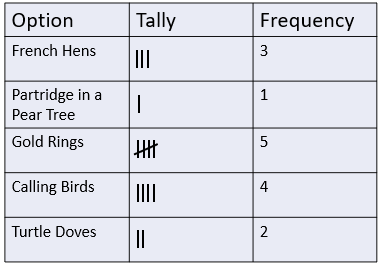
Question 1: Populate the frequency column.
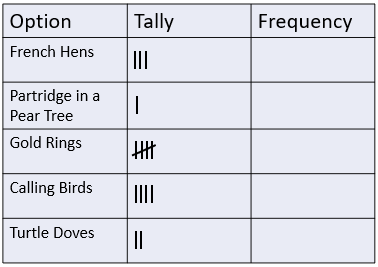
[1 mark]
Count the number of strikes in each row and add these values to the frequency column.
Question 2: Ella is counting the number of birds she sees in a forest. She sees three blue tits, seven sparrows, five pigeons and a robin. Create and populate a frequency table for this data.
[2 marks]
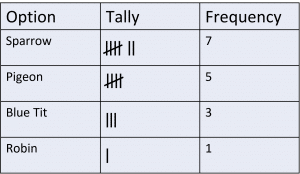
(The rows can be in any order here, as long as the tallies and frequencies are correct.)
Question 3: For this table of winter holiday options, three more people vote for a City Break.
a) Add these to the tally chart, and fill in the frequency column for the new data.
b) Does the most popular option have more than half of the total votes?
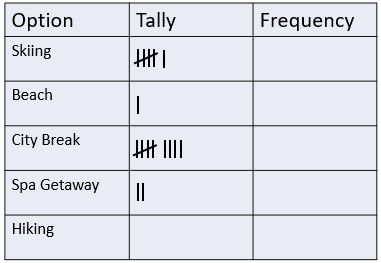
[4 marks]
a) Adding three more strikes to the City Break row, we have
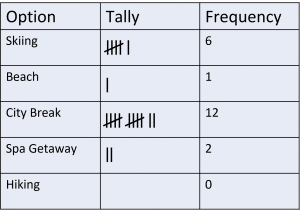
b) The total number of votes is
which is bigger than
So yes, the majority of the votes were for the most popular option (City Break).
Specification Points Covered
EL3.21 – Extract information from lists, tables, diagrams and charts and create frequency tables
EL3.22 – Interpret information, to make comparisons and record changes, from different formats including bar charts and simple line graphs
EL3.23 – Organise and represent information in appropriate ways including tables, diagrams, simple line graphs and bar charts