Functional Skills: Conversion Graphs
Conversion Graphs
Conversion graphs allow us to convert easily between units. They will all be straight line graphs with one unit on the the x-axis and the other on the y-axis. You will need to know how to use conversion graphs to convert units and potentially use them as part of a question.
Make sure you are happy with the following topics before continuing.
Functional Skills Maths Level 2 Revision Cards
Click here to Learn More
Conversion Graphs Method
When asked to convert units using conversion graphs, it is often useful to draw on the graph to help you.
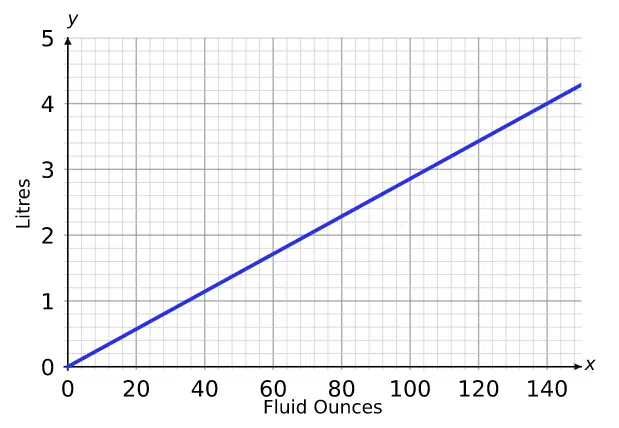

Example: The conversion graph shown is used for converting between litres and fluid ounces.
a) Convert \textcolor{limegreen}{2.5} litres into fluid ounces.
Step 1: On the y-axis start from \textcolor{limegreen}{2.5}, then draw a horizontal line until you meet the line.
Step 2: From this point, draw a vertical line downwards until it meets the x-axis.
Step 3: Read the value where the line meets the x-axis and this is the result of the conversion.
Using this method we can see that \textcolor{limegreen}{2.5} litres \approx \textcolor{limegreen}{88} fluid ounces.
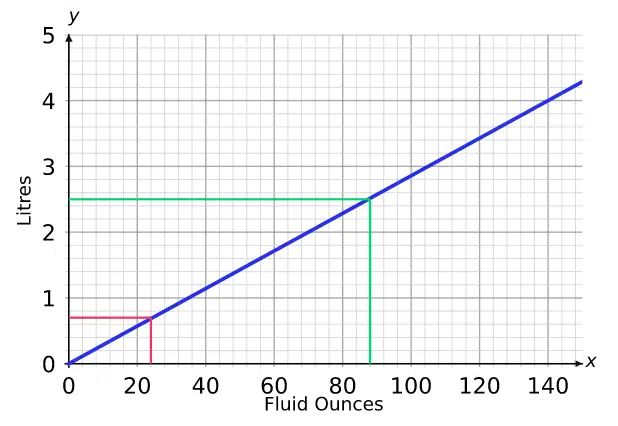

b) Convert \textcolor{red}{24} fluid ounces into litres.
Here, we have to reverse the process as we have to convert in the opposite direction: draw up to the line first, then across, and this time read off the result from the y-axis.
The \textcolor{red}{24} fluid ounce line finishes at round 0.7 on the y-axis.
So \textcolor{red}{24} fluid ounces \approx \textcolor{red}{0.7} litres.
Follow Our Socials
Our Facebook page can put you in touch with other students of your course for revision and community support. Alternatively, you can find us on Instagram or TikTok where we're always sharing revision tips for all our courses.
Example: Conversion Graphs
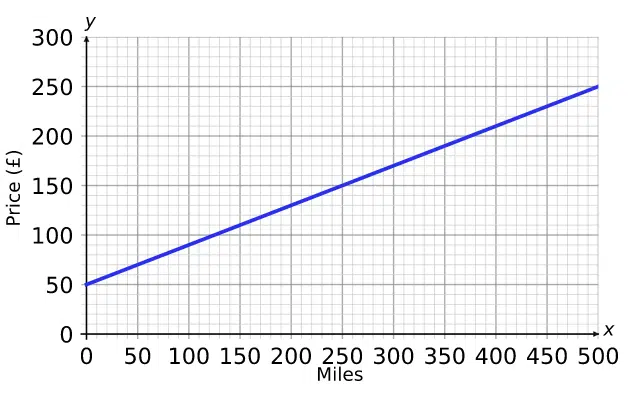

The relationship between miles driven and the price of a hire car is shown on the graph.
[2 marks]
a) Convert £100 into miles:
Draw a line from 100 on the y-axis to the blue line and then down to the x-axis. This gives a conversion of
\textcolor{limegreen}{£100} = \textcolor{limegreen}{125} miles
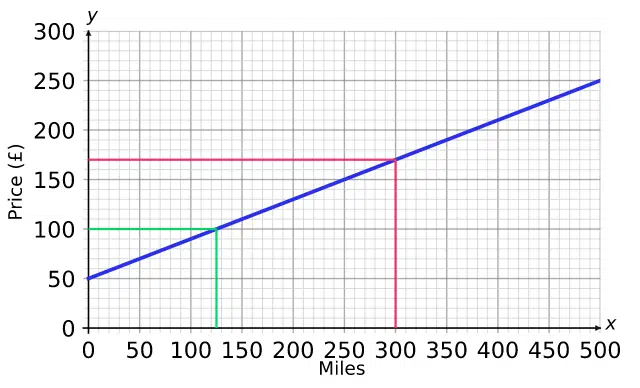

b) Convert 300 miles to £‘s:
Draw a line up from 300 on the x-axis to the conversion graph and then across to the y-axis. This gives a conversion of
\textcolor{red}{300} miles = \textcolor{red}{£170}
Functional Skills: Conversion Graphs Example Questions
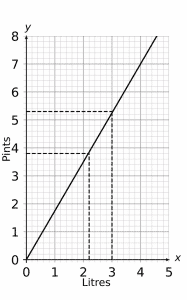
Question 1: Use the graph below to find an approximate value for the following conversions:
a) 3 litres to pints
b) 3.8 pints to litres
[4 marks]
a) Converting litres to pints, draw a line vertically upwards from 3 on the horizontal (x) axis until it touches the black solid line of the graph. Then we need to draw a line from this point horizontally to the left to find the corresponding value on the vertical (y) axis. This value falls between 5.2 and 5.4 pints, so the approximate answer is
3 litres = 5.3 pints
b) Converting pints to litres, locate 3.8 on the vertical (y) axis and draw a line horizontally to the right until it touches the blue line of the graph. Then we need to draw a line from this point vertically down to find the corresponding value on the horizontal (x) axis. This value falls between 2 and 2.2 litres. Since it is closer to 2.2 than 2, the approximate answer is
3.8 pints =2.15 litres
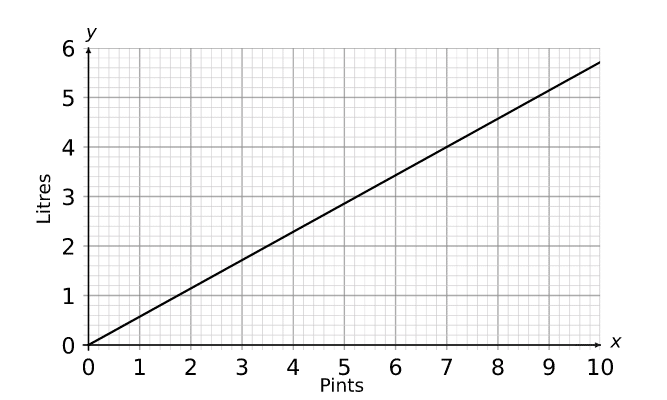
Question 2: Using the conversion graph find approximate values for:
a) The number of litres in 4 pints
b) The number of pints in 5 litres
[4 marks]
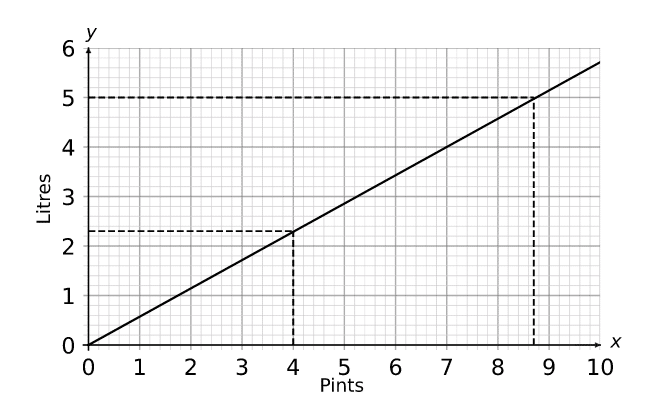
a) First find 4 on the x axis and go up until you touch the line. Then go across to the corresponding value on the vertical y axis. We can see that this line touches between 2.2 litres and 2.4 litres, so we can say that
4 pints \approx 2.3 litres
b) Find 5 on the y axis and go across to the right until you touch the line. Then go down to the corresponding value on the horizontal x axis. We can see that this line touches between 8.6 pints and 8.8 pints so we can say that
5 litres \approx 8.7 pints
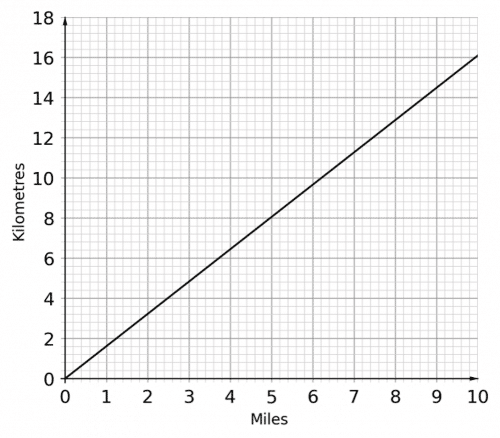
Question 3: Use the following conversion graph to convert 80 kilometres to miles.
[2 marks]
8 km =5 miles
Therefore 80 km = 5 \times 10 = 50 miles
Specification Points Covered
L2.14 – Convert between metric and imperial units of length, weight and capacity using a) a conversion factor and b) a conversion graph
Functional Skills: Conversion Graphs Worksheet and Example Questions
Conversion Graphs L2
FS Level 2NewOfficial PFSRevision Products
Functional Skills Maths Level 2 Book
Revise and practice for your functional skills maths level 2 exam. All topics covered in this compact functional skills maths revision guide book.
Functional Skills Maths Level 2 Mini Tests
Practice for your functional skills Maths level 2, questions from every topic included.

Functional Skills Maths Level 2 Revision Cards
Revise for functional skills maths level 2 easily and whenever and wherever you need. Covering all the topics, with revision, questions and answers for every topic.
Functional Skills Maths Level 2 Practice Papers
This 5 set of Functional Skills Maths Level 2 practice papers are a great way to revise for your Functional Skills Maths Level 2 exam. These practice papers have been specially tailored to match the format, structure, and question types used by each of the main exam boards for functional skills Maths. Each of the 5 papers also comes with a comprehensive mark scheme, so you can see how well you did, and identify areas to improve on.
Functional Skills Maths Level 2 Practice Papers & Revision Cards
This great value bundle enables you to get 5 functional skills maths level 2 practice papers along with the increasingly popular flashcard set that covers the level 2 content in quick fire format.

