
Functional Skills: Grouped Data
Grouped Data
When dealing with data it is sometimes easier to group the data into separate classes to make it easier to manage and view.
If you are grouping data into classes it is important that none of the classes overlap and they cover all the possible values from the data set.
Make sure you are happy with the following topics before continuing.

Tally Charts
Tally charts are often used to collect data.
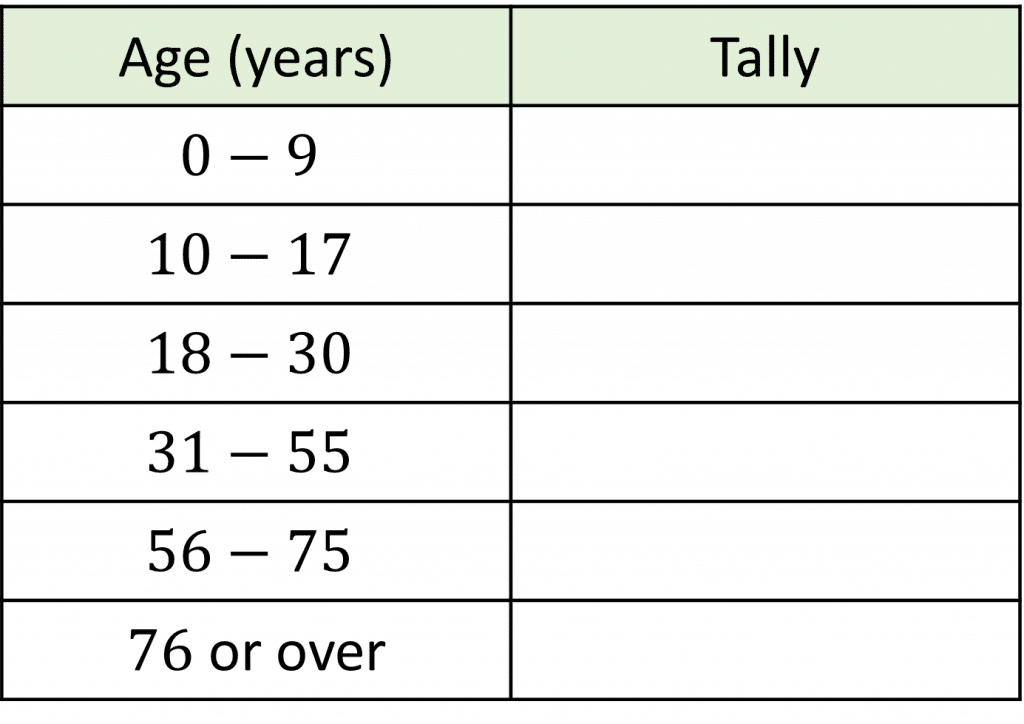
Example: Damian is recording a sample of the ages of people who attend a football match.
Design a table that could be used to collect the data.
It is a good idea to use a tally chart for this.
The ages of people attending the match needs to be grouped into classes that don’t overlap and include all of the possible ages.
When collecting the ages of people, there is technically no maximum age that someone could be, so make sure you include a class like “… or over”.
Follow Our Socials


Follow our Facebook for community support


Follow our Instagram & TikTok for revision help
Our Facebook page can put you in touch with other students of your course for revision and community support. Alternatively, you can find us on Instagram or TikTok where we're always sharing revision tips for all our courses.
Follow our socials for revision tips and community support
Frequency Tables
Frequency tables are an extension of tally charts, which include the number of values in a certain class rather than a tally.
Example: A tennis club records the number of aces hit by 20 players over an entire league season.
The recorded values are:
\boldsymbol{22, 17, 6, 2, 24, 28, 37, 31, 29, 4, 8, 12, 30, 21, 13, 15, 42, 19, 11, 46}
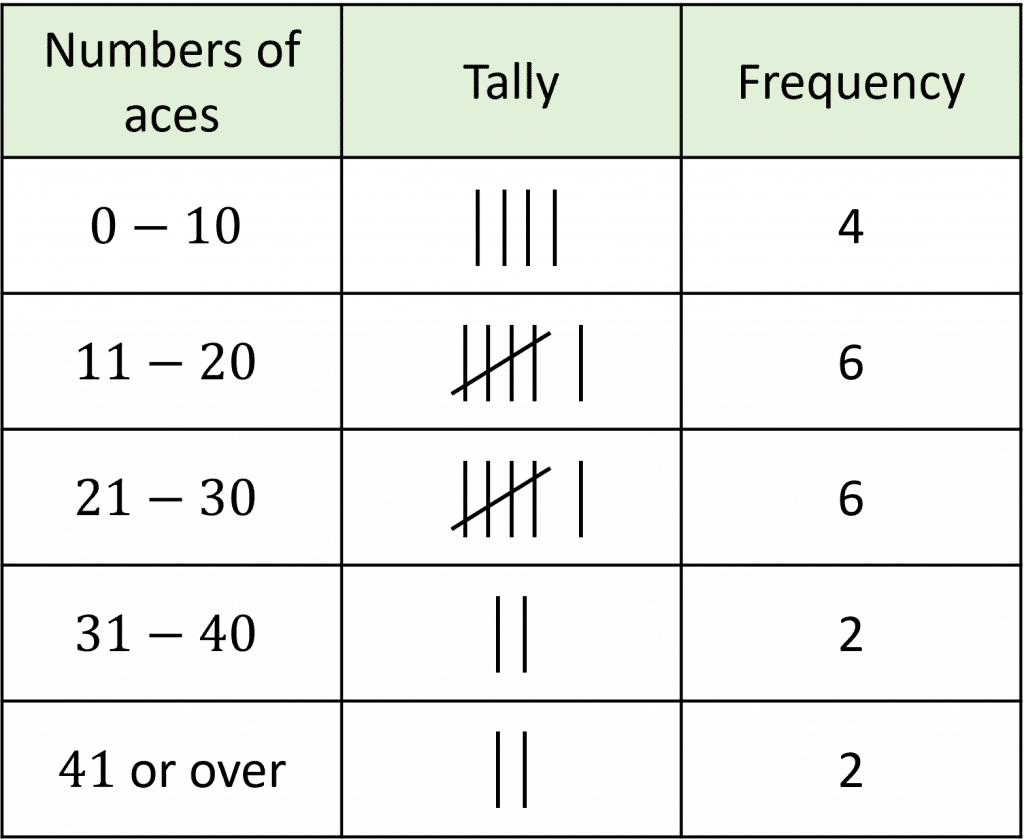
Create a table to organise this data.
A frequency table will be useful to organise this data into separated classes.
There is no maximum amount of aces a player can hit in a league season, so we must include a class that has no upper bound.
The range of possible scores as been divided up into five classes, with none of the classes overlapping.

Displaying Grouped Data
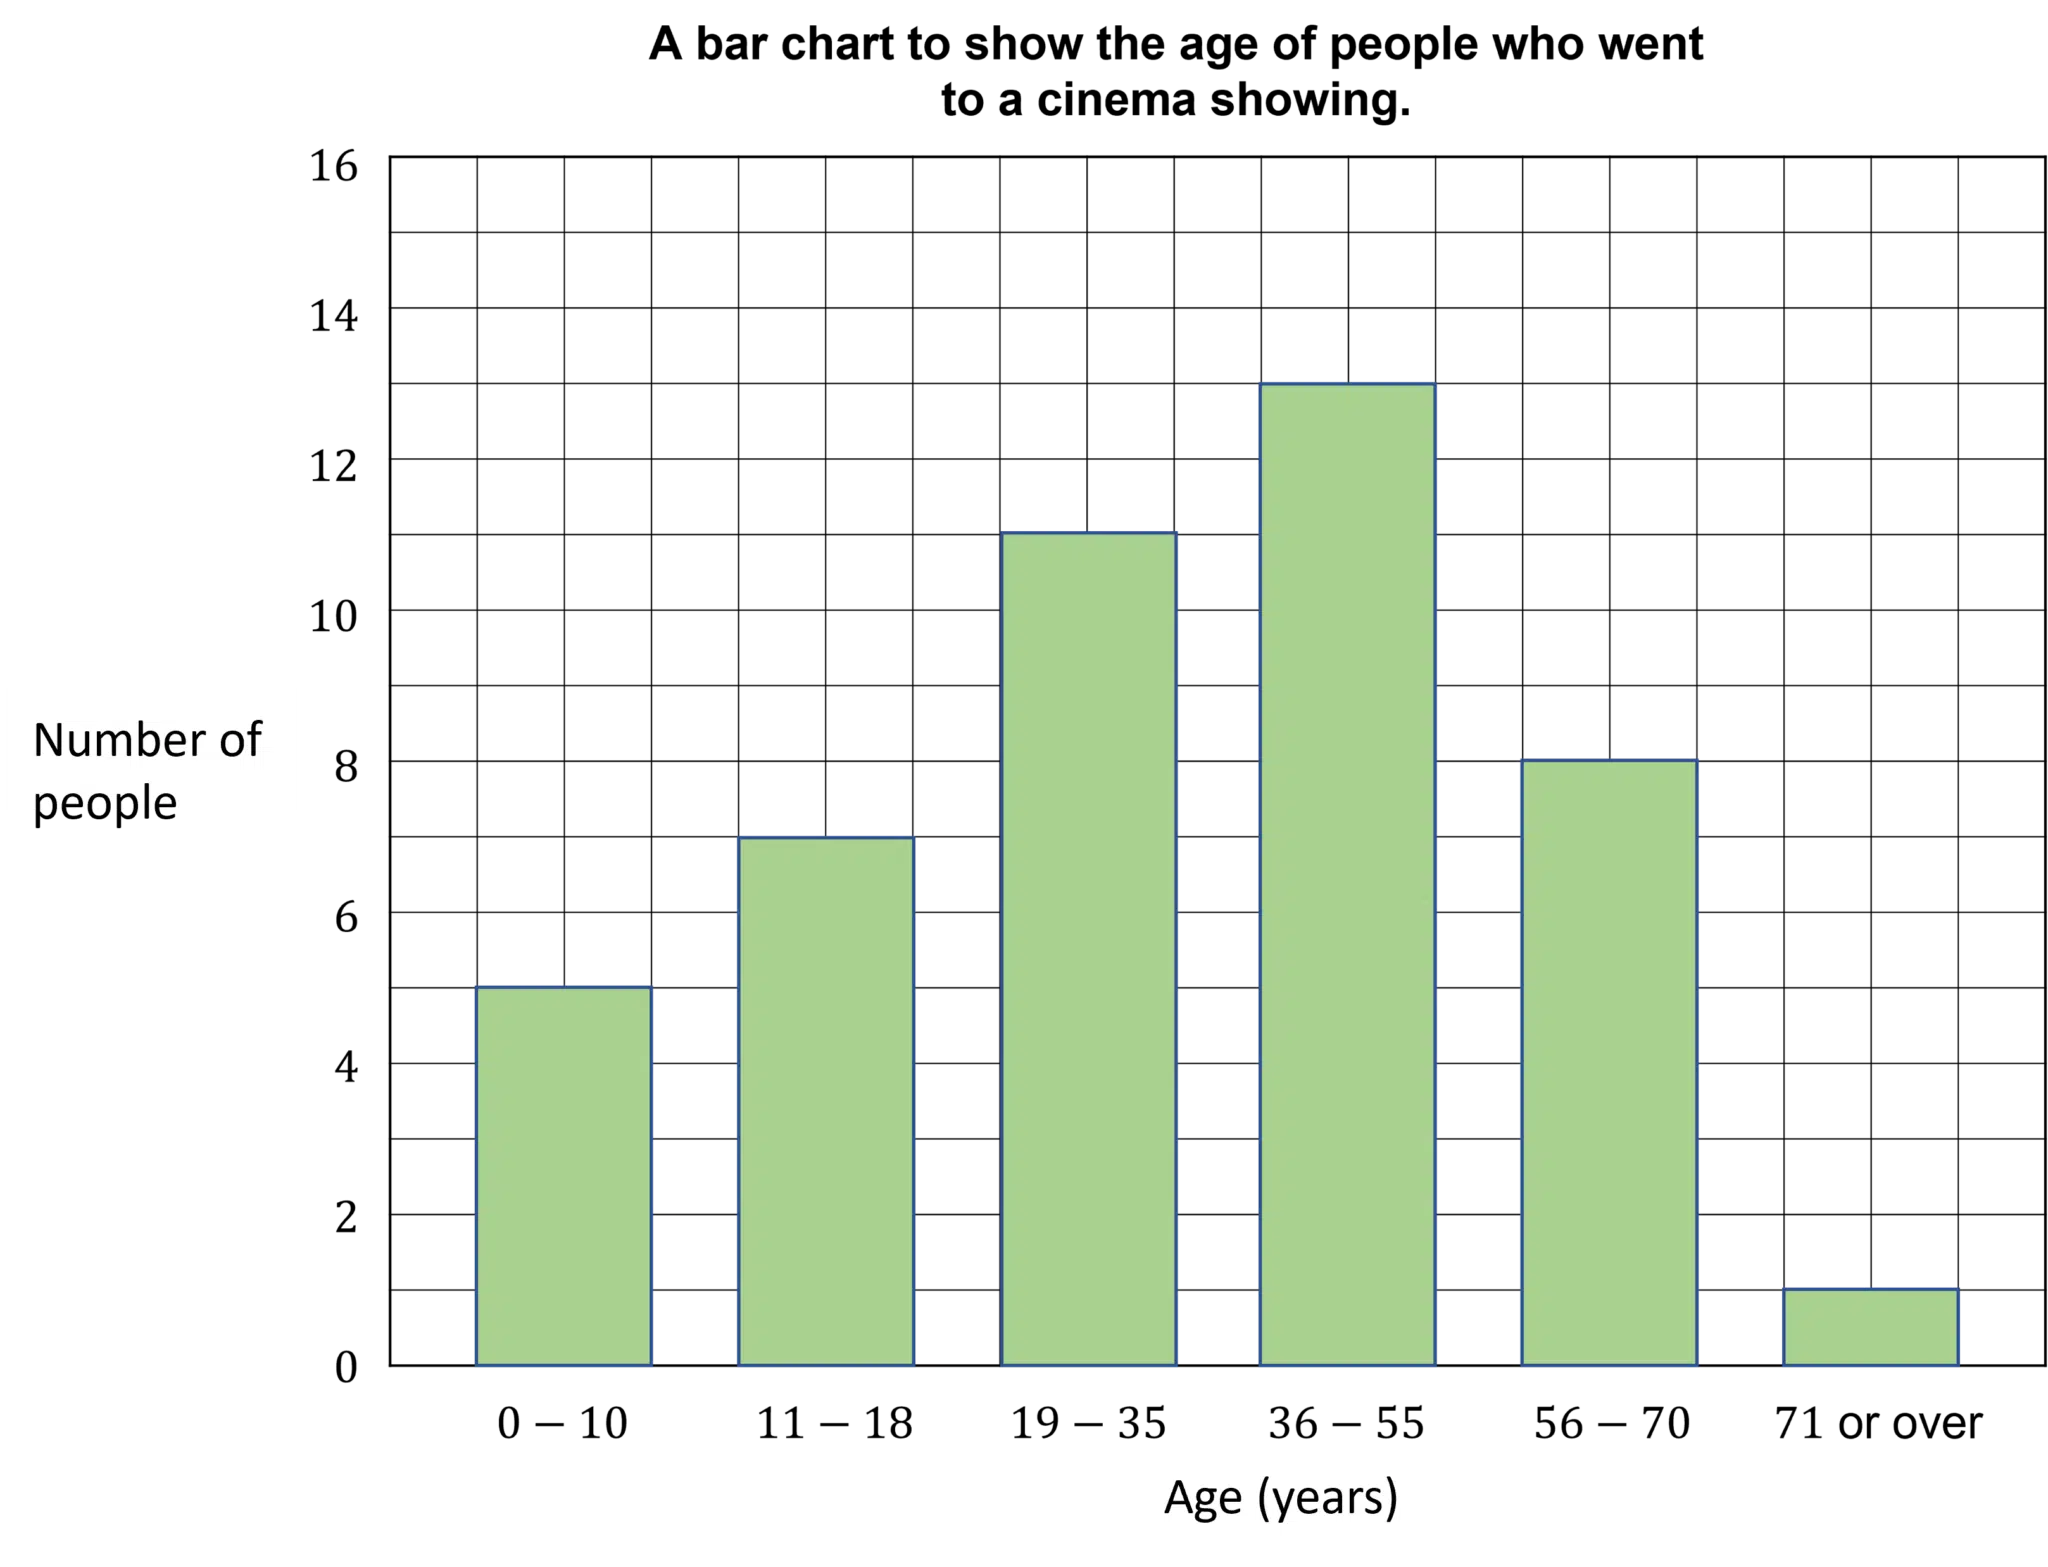
Bar charts can be used to display grouped data.
As shown in the bar chart below, there needs to be one bar for each class. It may be useful to refresh your mind on bar charts, by going back to this page.
The table shows the ages of 45 people at a cinema showing.
There are six classes in the frequency table, so the bar chart will have six bars.
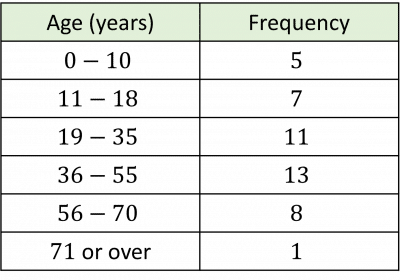
This bar chart displays the grouped data, this is constructed just like any other bar chart, with the classes on the horizontal axis and the frequency on the vertical axis.
Functional Skills: Grouped Data Example Questions
Question 1: Karen records the speeds of cars going past a primary school between the hours of 8am and 10am. Below is a list of the speeds she recorded:
19 mph, 32 mph, 15 mph, 22 mph, 29 mph, 18 mph, 24 mph, 36 mph,
14 mph, 25 mph, 39 mph, 31 mph, 9 mph, 12 mph, 7 mph
Draw a grouped frequency table to organise this information.
[2 marks]
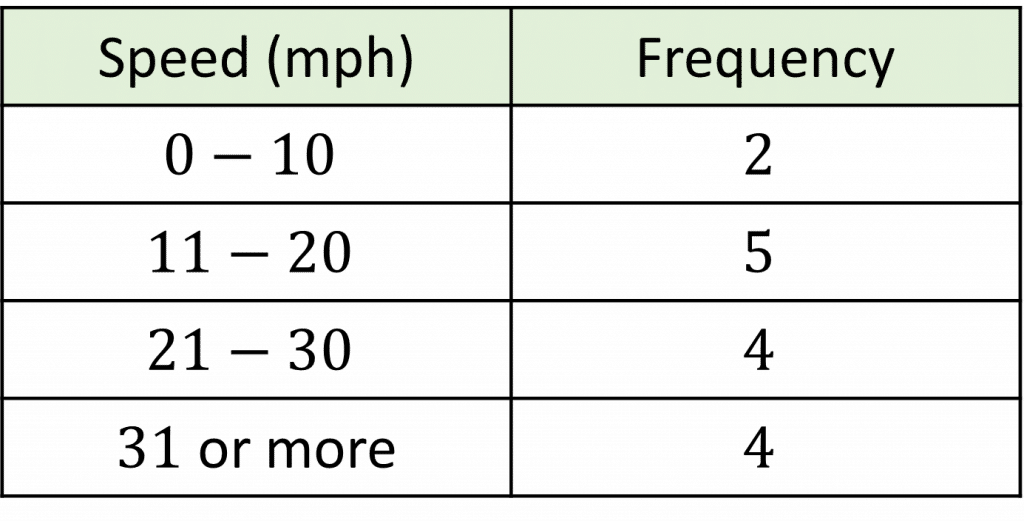
To make this table we need to make sure none of the classes overlap and we include all the possible values, hence we have a 31 or more class.
Question 2: The grouped frequency table below shows data about the ages of people on a bus.
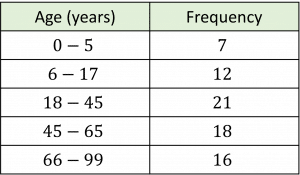
Identify two things wrong with the table.
[2 marks]
- We can see that the two classes: 18-45 and 45-65 overlap.
- The table doesn’t include all ages, e.g. someone who is 100 years old would not be included in the table.
Question 3: At a village fête, the total revenue from all the stalls is recorded, shown in the grouped table below.
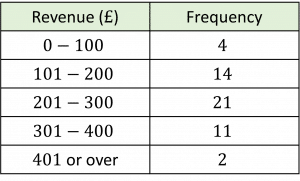
Represent this data in a bar chart.
[3 marks]
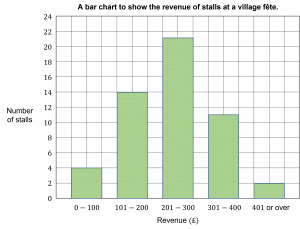
There is a bar for each class, the vertical axis is evenly distributed and it has a relevant title.
Specification Points Covered
L1.28 – Group discrete data and represent grouped data graphically