
Functional Skills: Data Tables
Data Tables
Tables are ways of displaying data in a clear way. The information will be shown in rows (across) and columns (down). There are many different types of table that you will see in mathematics, but here we will just look at a few.

Mileage Charts
Mileage charts are one type of table. They tell you distances between different places. There are a couple of different styles of mileage charts that you may see.
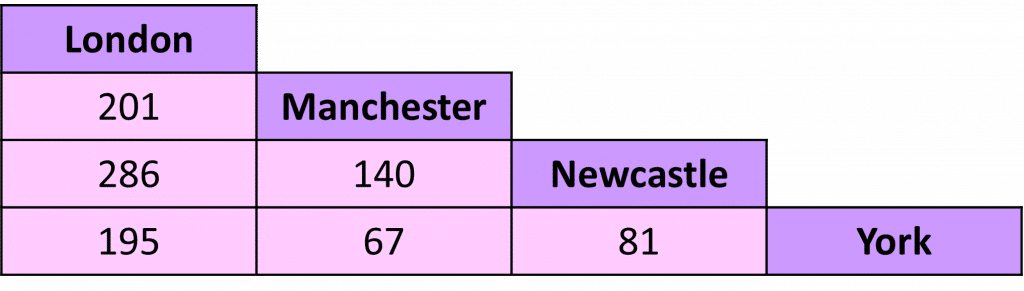
Example: Use the mileage chart to find the distance between Manchester and York.
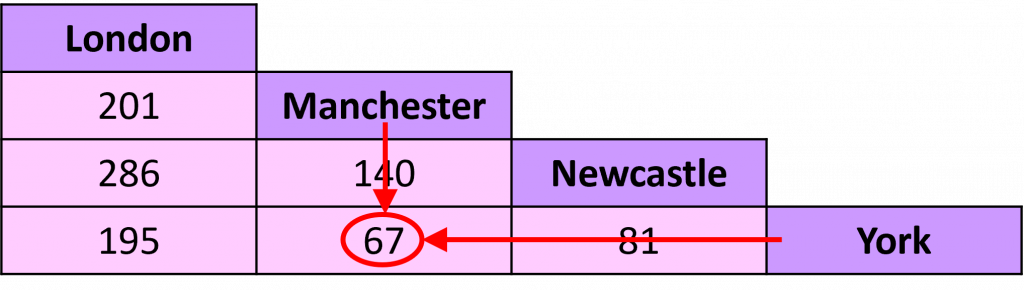
Step 1: Move down the column from the ‘Manchester‘ heading and across the row from the ‘York‘ heading.
Step 2: Where the row and column meet is the distance between the two places.
So, the distance between Manchester and York is miles.
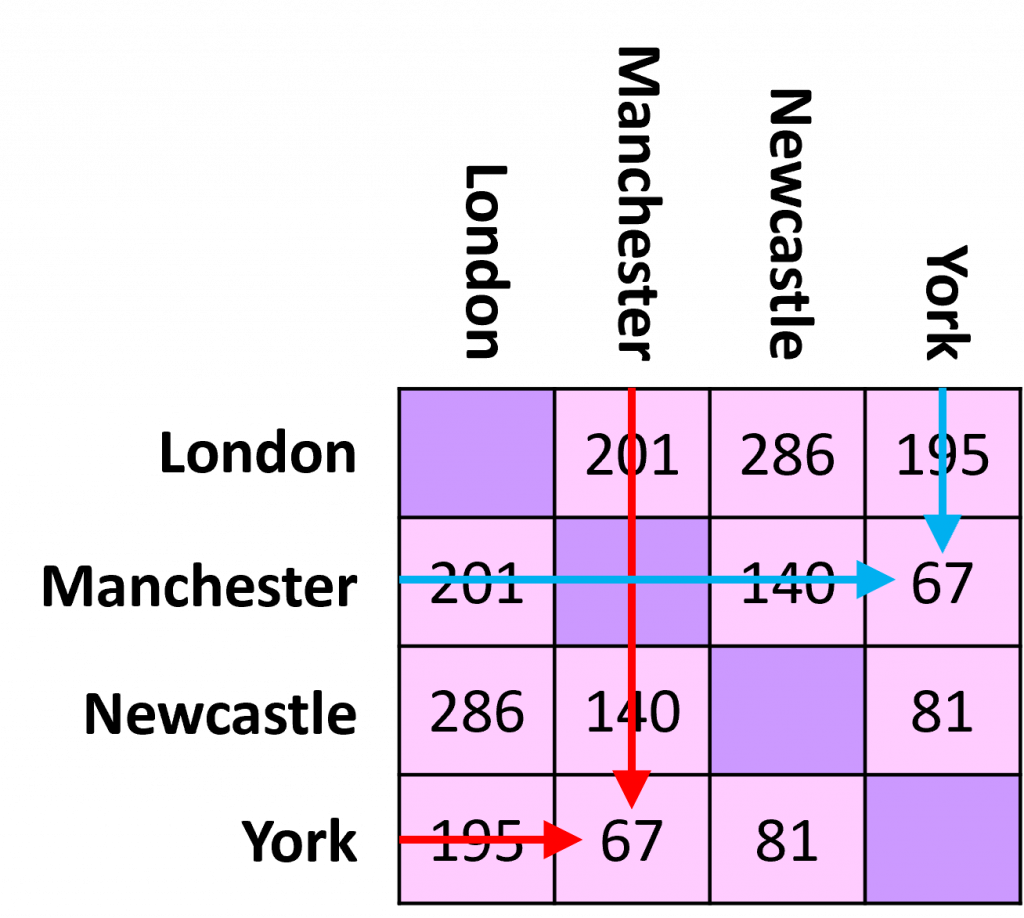
You may also see the data displayed in a mileage chart such as this:
The red arrows and blue arrows give the same result for the distance between Manchester and York, miles.

Follow Our Socials


Follow our Facebook for community support


Follow our Instagram & TikTok for revision help
Our Facebook page can put you in touch with other students of your course for revision and community support. Alternatively, you can find us on Instagram or TikTok where we're always sharing revision tips for all our courses.
Follow our socials for revision tips and community support
Tally Charts and Frequency Tables
Tally charts and frequency tables allow you to put data into different categories. Each row will show you how much is in each category.
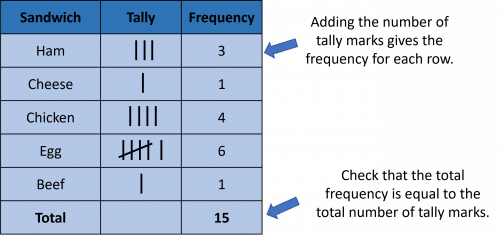
e.g. this tally chart shows types of sandwiches left in a café.
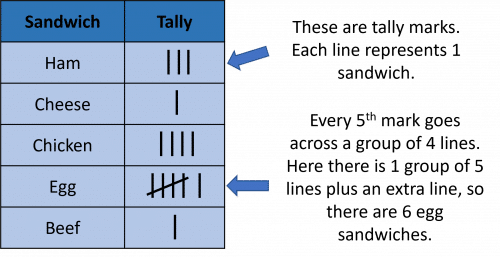
There are ham sandwiches, cheese sandwich, chicken sandwiches, egg sandwiches and beef sandwich left.
You can add a frequency column to the tally chart. Each row in the frequency column represents the total number of tally marks in each row.
Making Data Tables
A question may require you to create your own data table. There is no right or wrong way to do this, it just depends on what data the table is needed for.
You will need to make sure that the table has enough rows and columns to fit in all of the data.
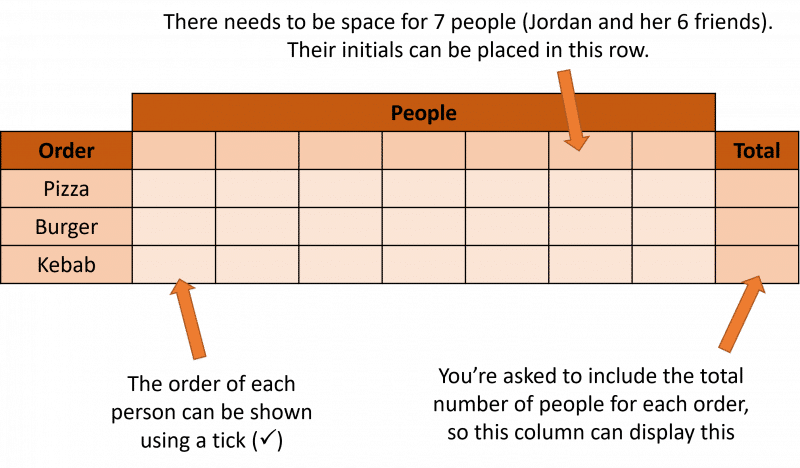
Example: Jordan is planning on ordering a group takeaway for her and her friends. To make things easier she decides that people can order either a pizza, a burger or a kebab.
Design a table to show each persons order and the total number of people that chose each option.
This table could look like this (remember there is no correct way!):
Functional Skills: Data Tables Example Questions
Question 1: Use the mileage chart below to answer the following questions.
All distances are shown in miles.

a) What is the distance between Hull and Manchester?
b) Frankie drives from Manchester to Lincoln and then to Hull. What is the total mileage for her journey?
[3 marks]
a) Going across from Manchester and down from Hull, until they meet, gives a distance of miles.
b) Going across from Manchester and down from Lincoln, until they meet, gives a distance of miles.
Going across from Lincoln and down from Hull, until they meet, gives a distance of miles.
Therefore, the total distance travelled by Frankie is
miles
Question 2: The tally chart below shows peoples’ favourite colour.
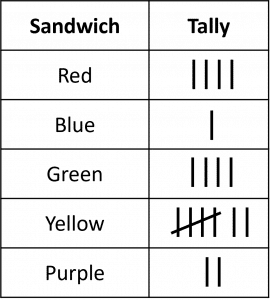
Use this table to answer the following questions.
a) How many people said that yellow was their favourite colour?
b) How many people were asked in total?
[3 marks]
a) There is a group of lines and extra lines, so the total is
b) Total people
Question 3: Jamie is a builder, he needs to order some materials from his supplier.
Design a table that Jamie could use to record the details of his order.
The table needs to include the items he needs to order, the number of each item and the price of each item.
It needs to include the total cost of the order also.
Design a table that Jamie could use.
[2 marks]
You could create a table of any style (there is no wrong or right way), as long as there is enough space for the information.
Here is an example:

Specification Points Covered
L1.27 – Represent discrete data in tables, diagrams and charts including pie charts, bar charts and line graphs